A Kitchen-Table Plan for Comparing Two Neighboring Regions
Compare two neighboring regions with one map scale and a shared feature list to spot differences in relief, routes, and settlements without confusing map detail for geography.
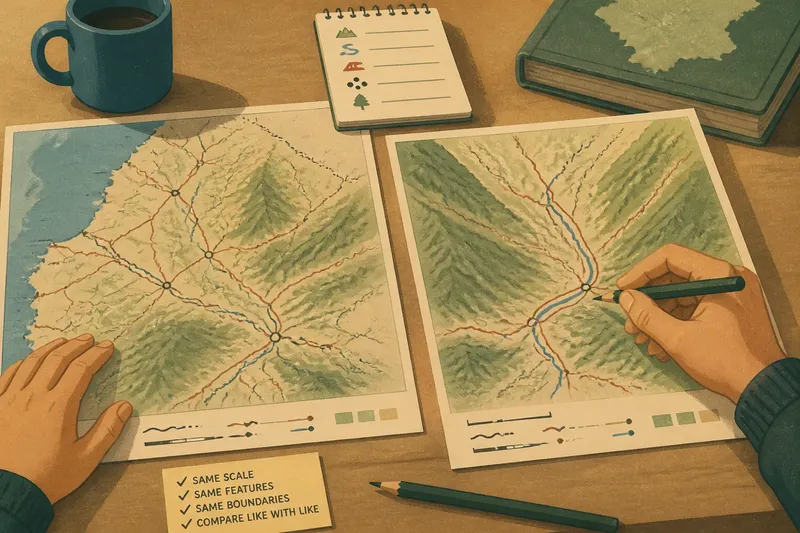
Two road maps lie side by side on a kitchen table, but one shows a whole province while the other is zoomed in on a valley. Comparing their road networks would be misleading before the first road is even traced. A fair comparison of two neighboring regions starts by making the evidence match: use the same map scale, the same kinds of features, and the same boundary for each region.
Frame the comparison
Choose regions that touch or sit close together, then define what counts as each region. A physical feature such as a mountain range may make a useful boundary, but administrative borders can be easier to identify consistently. The choice depends on the question. If you are comparing how people cross a mountain belt, draw the regions around the terrain and its approaches. If you are comparing public transport provision, a pair of adjacent administrative areas may be more useful.
Write down the boundaries before collecting observations. Otherwise, it is tempting to include a convenient town or road in one region and exclude an equally relevant one in the other. Use one atlas or mapping service for both areas, and keep the map extent and zoom alike. If you switch maps, check that their scales and feature conventions are comparable.
For a kitchen-table exercise, a printed atlas, a library map, or a free digital map on a phone or computer is enough. The point is not to assemble more material; it is to compare like with like.
Use one feature list
Keep the list short enough to apply carefully to both regions. Relief, routes, and settlement patterns make a useful starting set because they describe the ground, movement, and the places where people live. Add a resource only if it helps answer a clear question, such as whether farmland clusters on flatter land or whether a port connects the regions to wider trade routes.
- Relief: Note broad forms such as plains, plateaus, valleys, and steep uplands. If both maps show these forms clearly, compare where they sit; if one map obscures them, consult a matching physical map or mark the comparison uncertain.
- Routes: Trace main roads, railways, navigable rivers, passes, and ferry links. If the same route types are visible in both regions, compare where they converge, bend, or end; if coverage differs, use a map with consistent detail or limit the comparison to the shared route types.
- Settlements: Observe whether towns cluster along a coast, river, valley, or junction, or are spread across the interior. If the same settlement symbols or naming conventions apply, compare their distribution; if they do not, record the mismatch and avoid treating apparent counts as a regional difference.
- Resources: Where the map identifies them, record features such as forest, cultivated land, mineral areas, or ports. If both maps use a clear, comparable legend, compare the pattern shown; if the symbols are unclear or coverage differs, consult each map’s legend or leave that feature out.
- Boundaries: Check that the same boundary rule defines each region. If both borders are clearly marked, keep them fixed; if one is ambiguous, choose a consistently mapped administrative boundary or state that the comparison is limited.
- Scale and extent: Check the scale bars, map frames, or digital zoom and visible area. If both views match, compare the selected features; if they do not, adjust the view or postpone comparisons that depend on small details.
Apply each item to both regions before moving to the next. That small discipline reduces the chance of describing one area in detail while relying on a vague impression of the other.
Match map scale
Scale affects what can be seen. A regional map may show major highways and towns while leaving out local roads and small settlements. At a closer scale, those details appear, but the wider shape of the region may disappear. A comparison made from maps at different scales can make one place seem more connected simply because its smaller routes are visible.
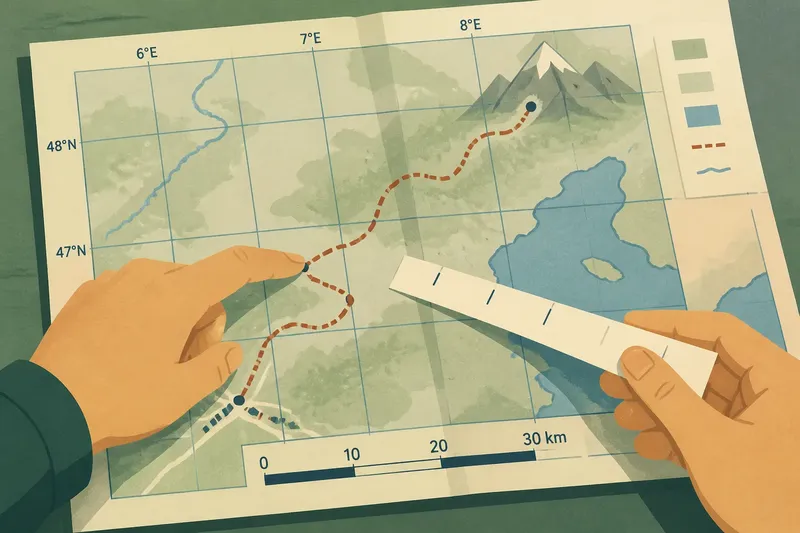
Use the same map scale for both regions wherever possible. On a printed map, compare the scale bars and map frames. On a digital map, set the same zoom and screen area, and avoid comparing a close view of one region with a broad view of the other. If the regions differ greatly in size, keep the scale the same and accept that the smaller region may occupy less of the page.
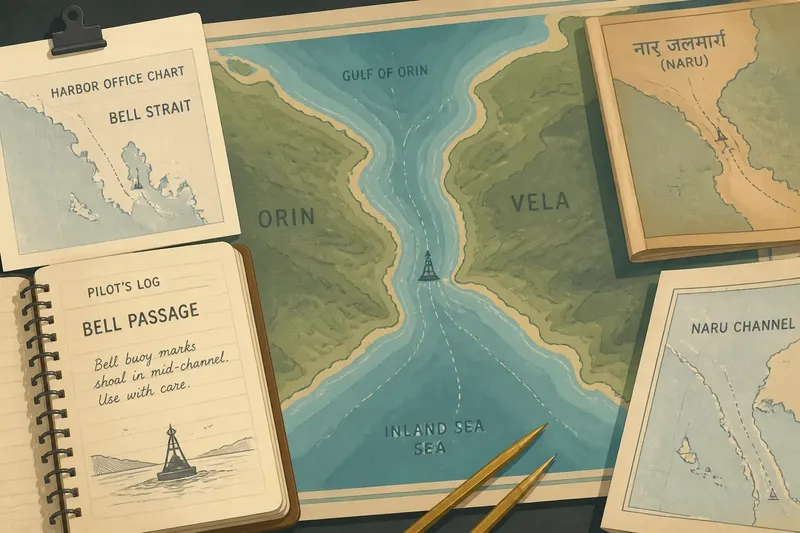
Some mapping services change the visible detail as you zoom or use different symbols at different views. If a detail matters, check it at the same closer scale in both places, then return to the shared regional view. When a symbol’s meaning is unclear, consult the map’s legend or its publisher’s notes rather than guessing.
Read routes with terrain
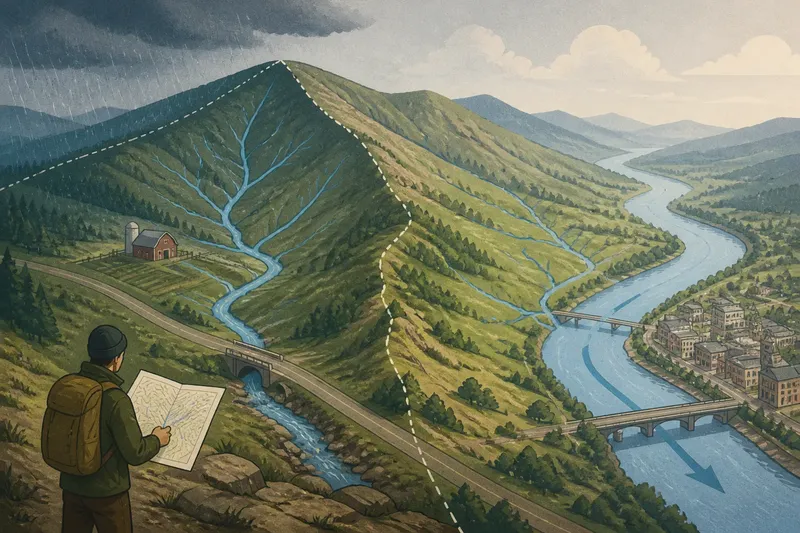
A route is more informative when read alongside the land it crosses. A road that follows a valley may link settlements while avoiding steep slopes. A railway that stops at a mountain edge may connect to a pass or a different mode of travel, or it may simply end there. The map can suggest these relationships, but it cannot establish every reason behind them.
Say you are comparing two neighboring upland regions. In Region A, the main road follows a broad valley between several towns; in Region B, roads approach from the lowlands and converge at a single pass. Mark those patterns with the same symbols on both maps. The expected result is a comparison of route structure and terrain, not a claim that one region is more accessible in every practical sense.
Notice missing links as well as visible ones. A river may look like a route, but navigation depends on conditions the map may not show. A border crossing may be marked without conveying its operating arrangements. Record what the map displays, then keep interpretation separate from observation.
Compare settlement patterns
Start with distribution: are settlements concentrated near the coast, strung along a river, gathered at road junctions, or scattered across a plain? Then compare their relationship to relief and routes. A cluster near a pass may sit at a natural crossing; a line of towns along a river may reflect the corridor the river creates. These are useful possibilities to investigate, not automatic explanations.
Use the same settlement categories for each region. For example, distinguish the largest labeled towns from smaller named places, rather than counting every place name on one map and only major cities on the other. If the map uses different symbols or naming conventions, note that limitation instead of treating the apparent difference as a regional fact.
A compact note can keep observations clear: “Region A: settlements mainly along the lower river; Region B: more dispersed around the plateau edge.” Add a separate sentence for interpretation, such as “The river corridor may support easier movement.” This distinction makes it easier to revise an idea when another map complicates it.
Questions about map comparisons?
Why compare neighboring regions?
Nearby regions may share some broad conditions while differing in terrain, routes, or settlement. That can make contrasts easier to notice than when comparing distant places with many unrelated differences. Proximity alone does not explain a pattern, since the regions may have different histories, policies, or map coverage.
What if the regions differ in size?
Keep the scale and feature list the same, then compare patterns rather than raw counts. A larger region naturally has more room for towns or routes, while the map can still show whether those features cluster or spread out. State the size difference in your notes so it does not quietly shape the conclusion.
Can a digital map replace an atlas?
It can serve the exercise if both regions are viewed with matching zoom, map style, and extent. Digital maps are convenient for checking details, but labels and visible features may change with zoom or settings. An atlas can offer a stable view that is easier to compare at a glance.
How should uncertain observations be recorded?
Mark them as uncertain and name what is unclear: a faint route, an ambiguous boundary, or a symbol without a legend. Avoid filling the gap with a confident explanation. A second map with a clear legend can help resolve it.
Build a useful comparison
End with a small table or two short columns, one per region. Use matching rows for relief, routes, settlements, and any chosen resource. Beneath each row, write one observation and, only where the map supports it, one cautious interpretation. The shared structure makes contrasts visible without forcing the regions into a single story.
Imagine you have two printed maps of neighboring uplands: both use the same scale and show roads, rivers, towns, and contour lines. First, mark the same administrative boundary on each map and note that the regions are different sizes. Next, trace the main roads in blue pencil, river corridors in green, and label the largest towns using the same category. Then record what is visible: Region A’s road follows a broad valley and passes several towns; Region B’s roads meet at a mountain pass, while its settlements sit farther apart. The resulting comparison is that A shows a valley-centered route pattern and B a pass-centered one; it does not establish which region is easier to travel through, because the maps do not show every operating condition.
For a quick check, ask whether the same scale, boundaries, symbols, and feature categories were used on both sides. If any answer is no, adjust the comparison or mark the limitation. Comparing neighboring regions works best when each observation answers the same question, and when map details are treated as evidence with clear limits.
Keep the original maps beside your notes. When a new question arises—why a settlement sits apart from the main route, for instance—you can return to the visible evidence and decide what additional map or local context would actually help.